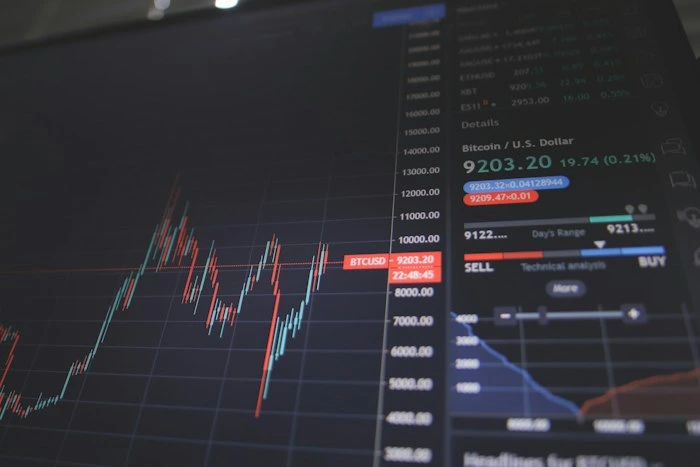
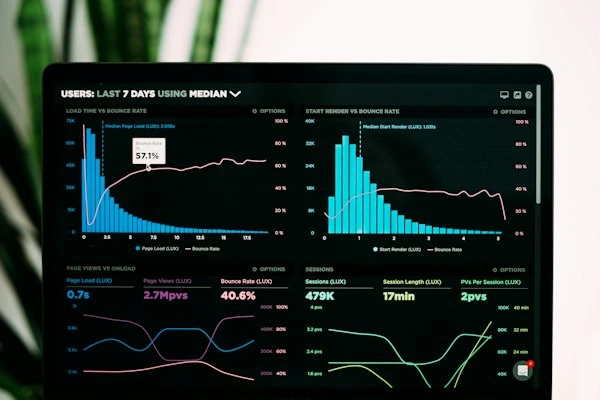
Documenting Aarav’s investment process, research decisions, risk assessments, and continuous learning as a student thinker.
Portfolio Scope & Status
This portfolio tracks a combination of simulated strategies and personal research methodologies for educational purposes. This distinction remains unmistakable and transparent across all reported metrics.
Visualizing sector exposure and asset allocation balance.
Performance Context & Metrics
Performance is presented with full contextual data. Account values are omitted to protect personal privacy, focusing entirely on relative percentage metrics without celebratory distortion.
Measurement Period
Aug 2026 – Present
Active Tracking
Realized & Unrealized Returns
+8.4%
Simulated Status
Benchmark (S&P 500)
6.1%
Over Same Period
Capital Actions
No Dividends
Clean Baseline
Journal Entries &Deep Reflections
Structured Case Studies
October 12, 2026 Software Infrastructure
Case Study: Evaluating Software Infrastructure Resilience
What does the company or asset do?
Provides cloud infrastructure security solutions for digital-first enterprises.
Why was it interesting?
Their high recurring revenue model presented a solid defensive moat during market corrections.
Consistent net retention rates remaining above 115% quarter over quarter.
What were the largest risks?
Elevated valuation multiples and aggressive competition from mega-cap cloud ecosystems.
What happened afterward?
Growth met initial forecasts, though short-term margin compression appeared mid-quarter.
What did Aarav misunderstand or underestimate?
Customer acquisition costs (CAC) took longer to optimize than initially built into the model.
What would change his opinion?
A sustained drop in net retention or major enterprise churn.
What will he investigate next?
Free cash flow conversion efficiency relative to ongoing capital expenditures.
Research Process Note:
All theses are evaluated through quantitative metrics and qualitative behavioral observations.
Disclaimer: This website documents a student’s learning and personal experience. It is not financial advice or a recommendation to buy or sell any investment.